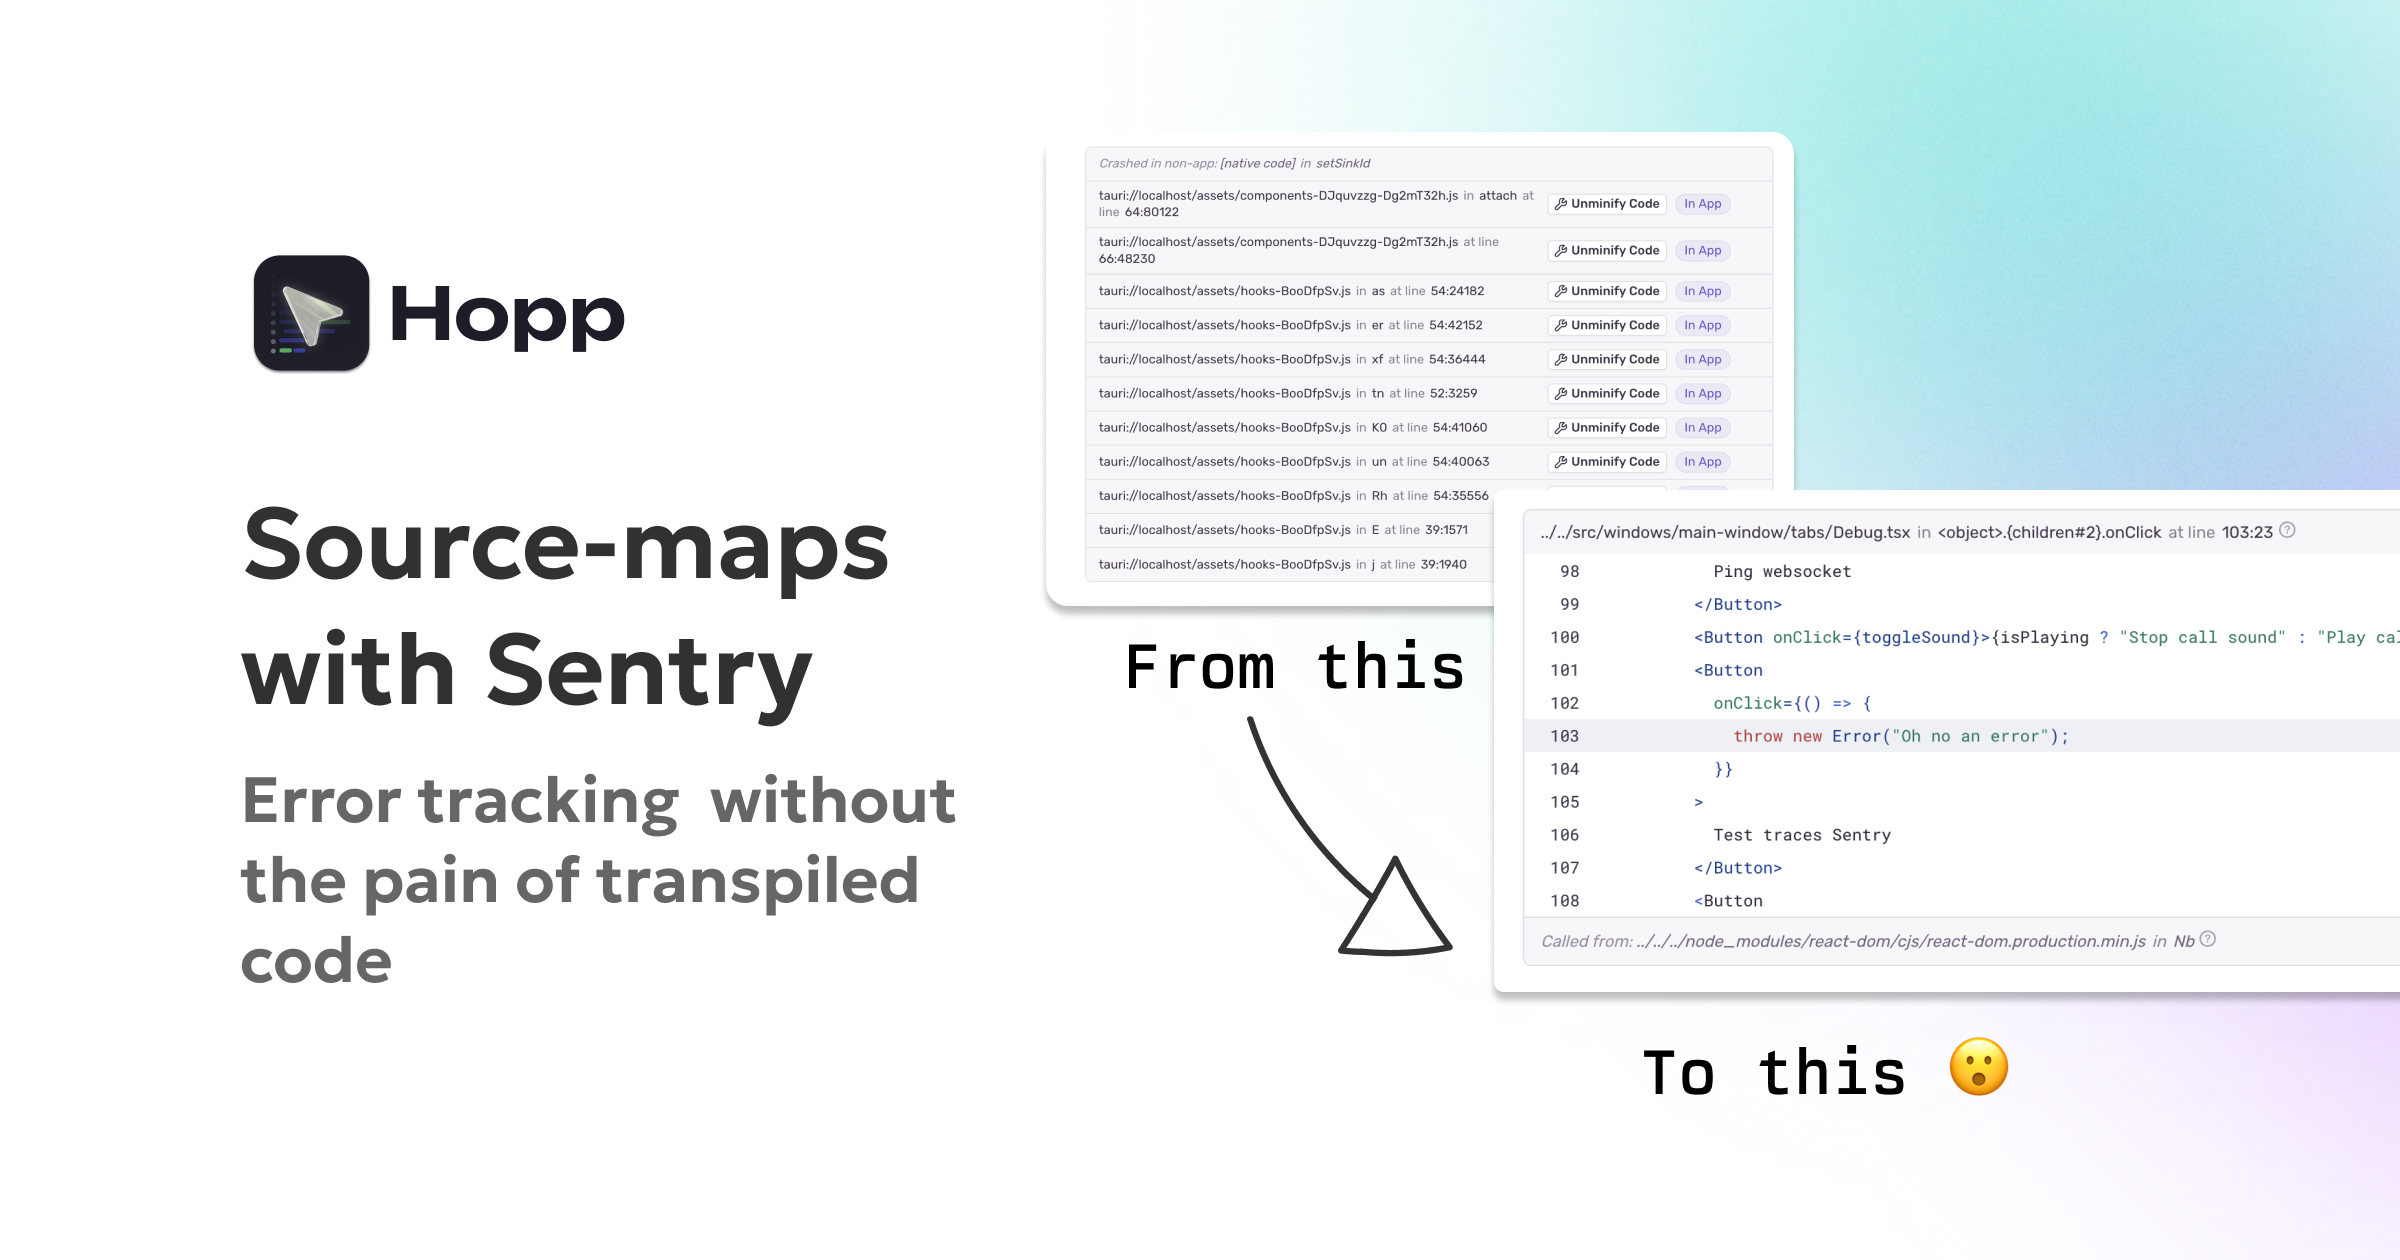
Sentry Errors Are Unreadable by Default. Here's How to Fix It with Source Maps
How we enabled meaningful error tracking in a Tauri (React) application using Sentry and source maps, solving the problem of minified, unreadable error logs.

I'm on X/Twitter at@CostasAlexoglou
Contents#
- What Is The Actual Problem
- Why Error Stack Traces Break in Production
- What Are Source Maps (and Why We Need Them)
- Why Not Ship Source Maps in the App?
- Uploading Source Maps to Sentry (Using the Sentry Vite Plugin)
- Verifying It Works (Readable Errors at Last!)
- Conclusion
What Is The Actual Problem#
By default, our production JavaScript is bundled and minified (compressed and optimized). When an error occurs, Sentry would report it with a stack trace referencing the minified code (often a single line of obfuscated code). This made debugging nearly impossible, as we couldn’t directly see what part of our source code caused the issue.
In the sections below, I’ll walk through why this problem occurs and how using source maps (and Sentry’s build integration) can fix it.
Why Error Stack Traces Break in Production#
When we build our Tauri app’s front-end, Vite produces optimized JavaScript. This involves two things:
- Transpilation: Converting modern JSX/TypeScript into plain JavaScript that browsers (or the WebView in Tauri) can run.
- Minification: Removing whitespace and shortening variable names to reduce file size.
Both are great for performance, but terrible for readability of errors. Let’s look at a quick example. Suppose our React component source looks like this (in TypeScript/JSX):
import { useState } from "react";

const HelloWorld = ({ title }: { title: string }) => {
  const [state, updateState] = useState<string>("wow");
  return <div>{title}</div>;
};
After the transpilation process, the transpiled output might resemble:
import { jsx as _jsx } from "react/jsx-runtime";
import { useState } from "react";
const HelloWorld = ({ title }) => {
  const [state, updateState] = useState("wow");
  return _jsx("div", { children: title });
};
Even without full minification, you can see the code has been transformed (e.g. our JSX turned into a _jsx function call). In a fully minified bundle, this could be squeezed into one line, with variable names like a and b. Now imagine an error occurs in this component – the stack trace will refer to something like HelloWorld.js:1:12345, pointing to the minified code. Debugging from that is extremely difficult.
We attempted a build with no minification, which made the code slightly more readable and only increased our bundle from ~12 MB to ~14 MB. However, the code was still transpiled (not identical to our source), so line numbers and function names didn’t match exactly. The real solution was to utilize source maps.
What Are Source Maps (and Why We Need Them)#
Source maps are files that map the transpiled code back to the original source code.
To understand better how they work, there is an amazing website, source-map-explorer, where you can play around with your source maps or we the pre-built examples.
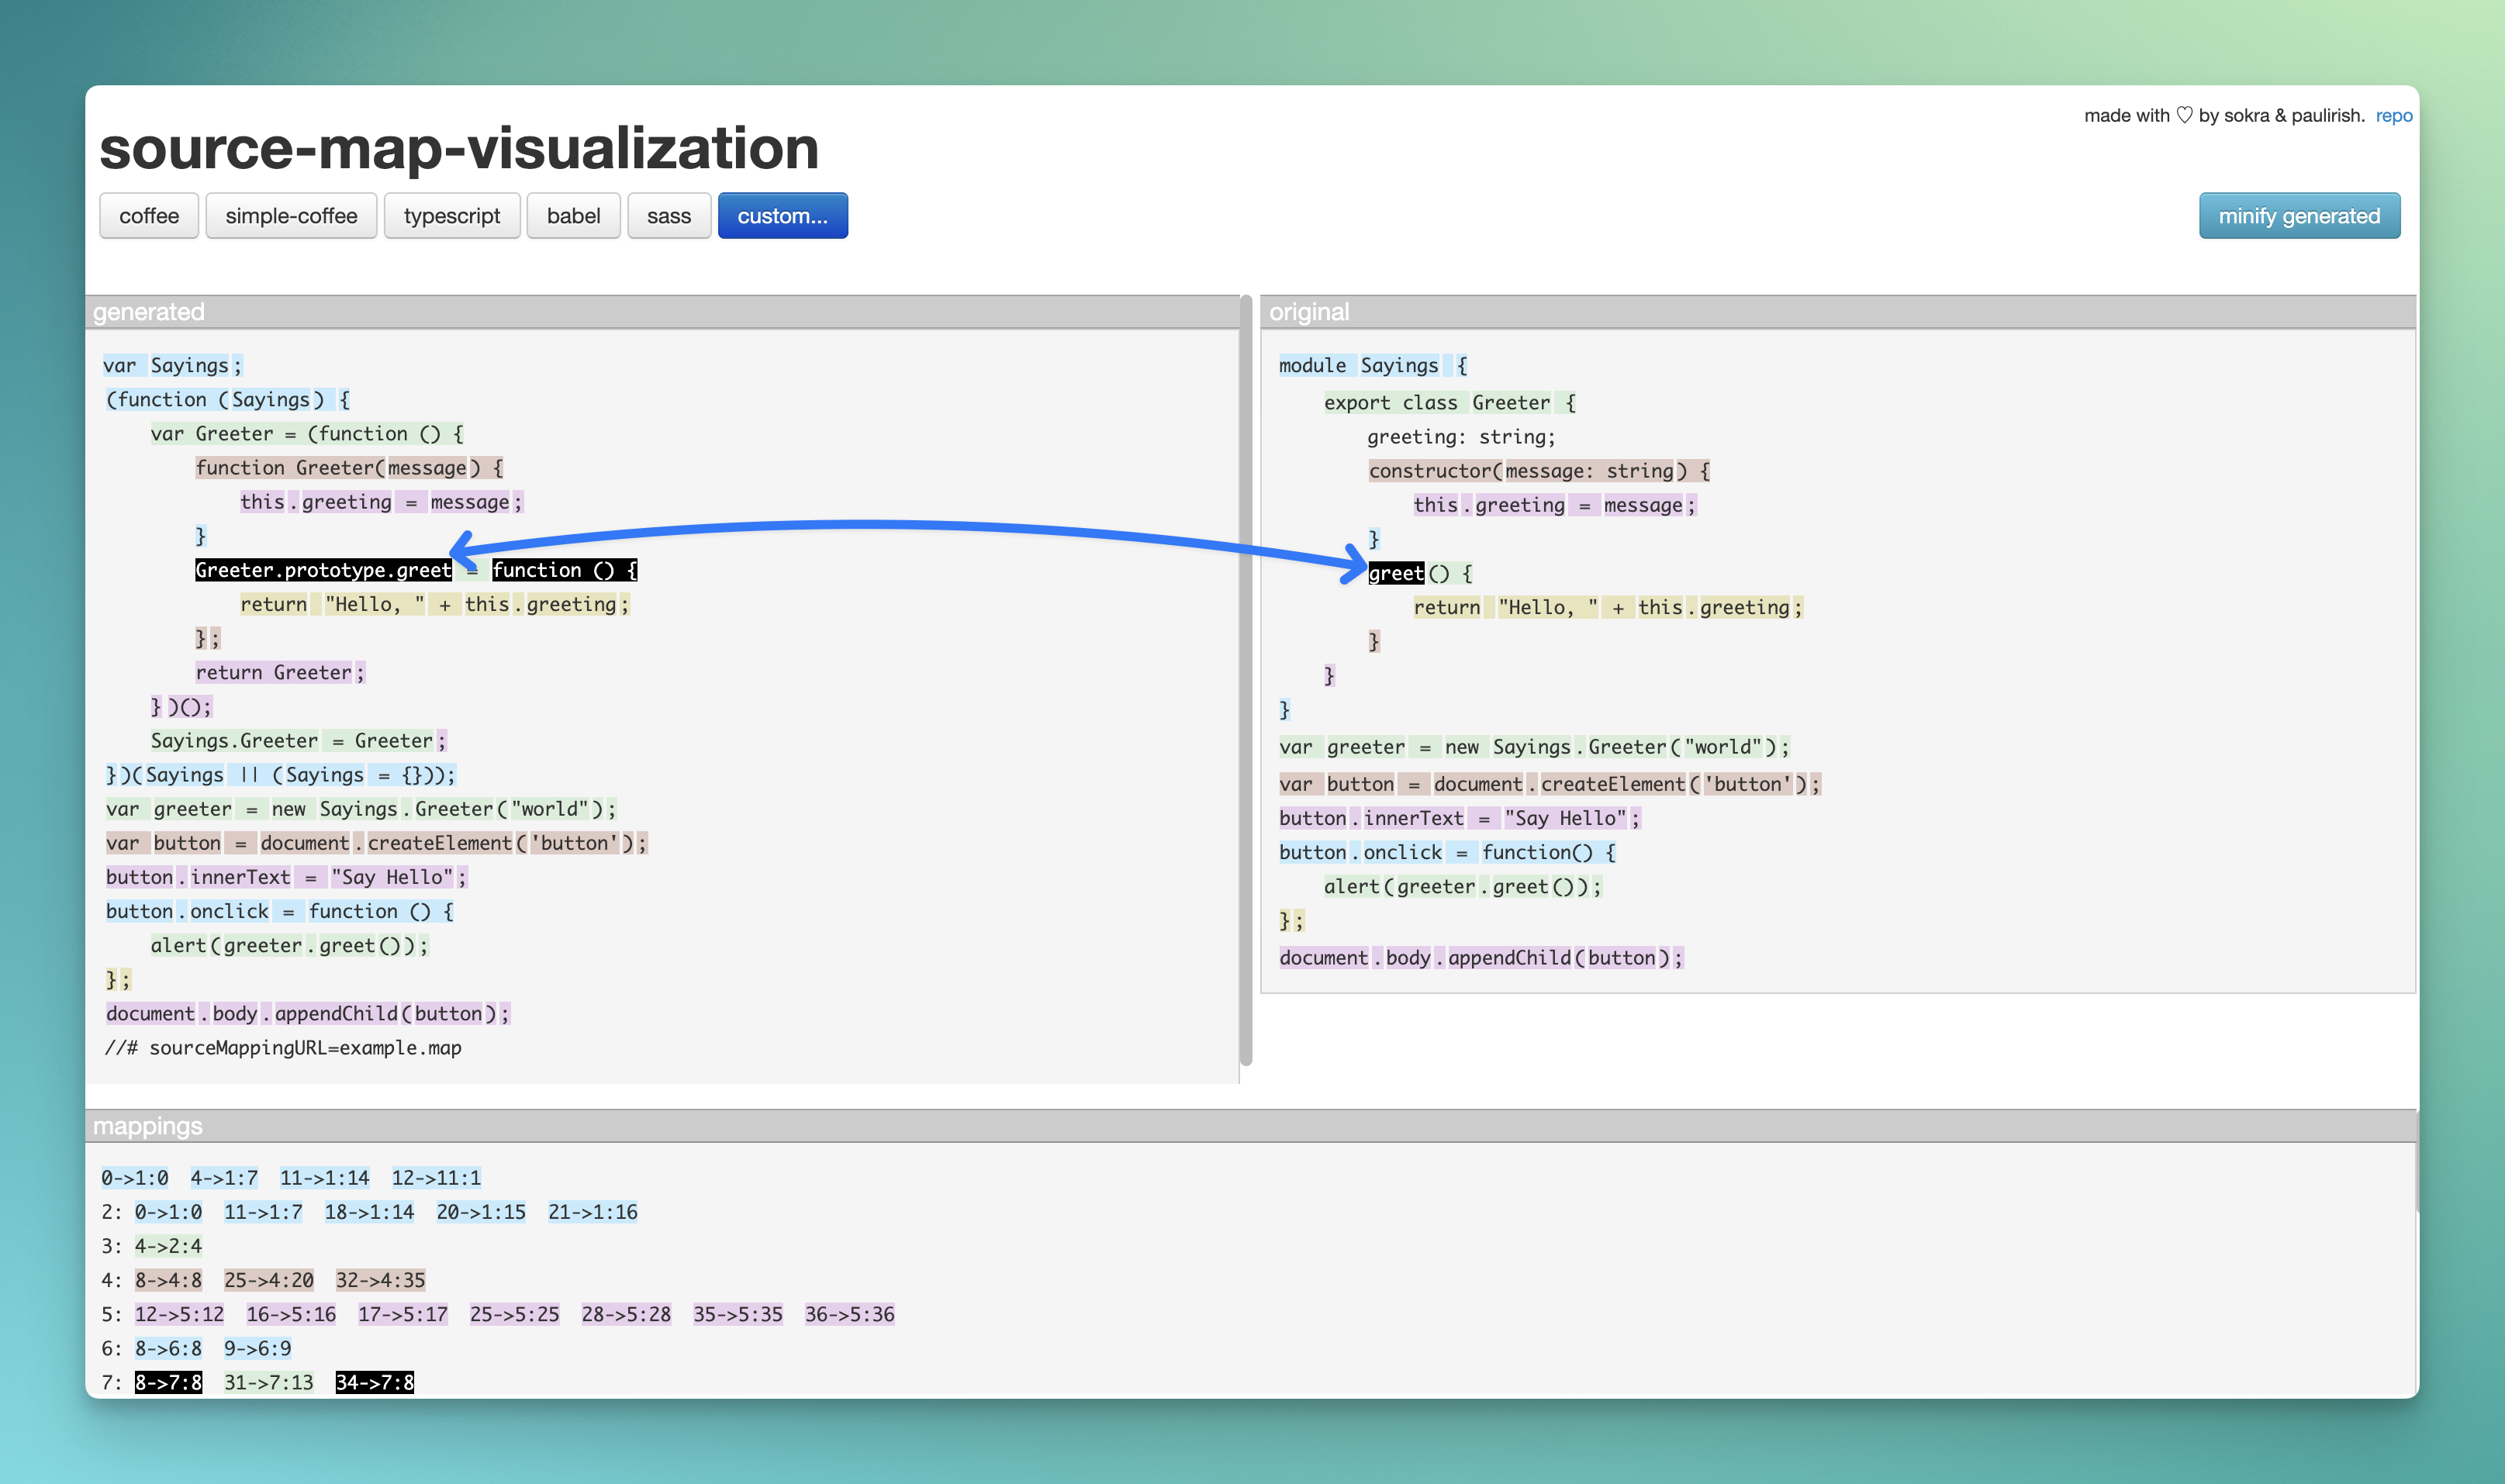
A source map allows debugging tools to translate from the location in a minified file to the corresponding location in your original, untransformed code. For example, if an error occurs at column 5000 of bundle.js, a source map can tell us it corresponds to, say, line 42 of HelloWorld.tsx in our source.
In practice, source maps are usually .map files generated alongside your JS bundles. They contain a JSON mapping of every symbol and line from the minified file to the original file. When enabled, tools like browser DevTools or Sentry can use them to display stack traces and code in terms of your original source.
And then the benefit of using source maps with Sentry is that error report can show us the actual line of our React component that failed, instead of an unreadable blob of minified code.
Why Not Ship Source Maps in the App?#
It might sound tempting to just include the source maps with our application bundle. Then Sentry (or even end-users in DevTools) would automatically get the decoded errors. However, there are two major drawbacks to embedding source maps in a production app:
- Huge file size increase: Source map files can be massive. In our case, the production bundle jumped from
~12 MB (minified)to~47 MBwhen we included source maps! 🔼 This 4x size bloat is unacceptable to ship to every user.
For comparison:
| Build Type | File Size |
|---|---|
| Without minification | ~14 MB |
| With minification | ~12 MB |
| With source maps included | ~47 MB 😱 |
- Potentially exposing source code: Source maps essentially contain your original source. If you include them publicly, savvy users could reconstruct a lot of your source code. This might be fine for open-source projects, but not ideal for a proprietary app.
So, directly shipping source maps inside the app was a non-starter. We needed a way to get the benefits of source maps without burdening our users with large binary files. This is where Sentry’s integration comes in.
Uploading Source Maps to Sentry (Using the Sentry Vite Plugin)#
Fortunately, Sentry provides tools to handle source maps on their side. The idea is:
- Generate source maps during your build (but do not bundle them with the app distributed to users).
- Upload those source maps to Sentry’s server.
- When an error occurs, Sentry will use the uploaded source maps to de-minify the stack trace, showing you the original code context in the Sentry dashboard.
This way, end-users never download the .map files, only Sentry has them. We get the best of both worlds: small app size and meaningful error debugging.
Sentry has official plugins for popular build tools (Webpack, Vite, etc.) to streamline this. In our case (using Vite), we leveraged the @sentry/vite-plugin. This plugin automates the release setup and source map upload as part of the build process.
Here’s how we integrated it into our Tauri app’s build:
- Install Sentry SDK and Vite plugin: (e.g.
npm install @sentry/react @sentry/vite-plugin). We also set up Sentry in our app code with Sentry.init(...) including our DSN, as usual. - Configure Vite to produce source maps: In
vite.config.ts, ensure the build is configured with sourcemap: true for production. Vite doesn’t output source maps for production builds unless you enable this. - Add the Sentry Vite plugin in vite.config.ts: We include the plugin with our Sentry project details. For example:
// vite.config.ts
import { defineConfig } from 'vite';
import { sentryVitePlugin } from "@sentry/vite-plugin";

export default defineConfig({
  plugins: [
    // ...
    // Enable Sentry plugin only if SENTRY_AUTH_TOKEN is present
    process.env.SENTRY_AUTH_TOKEN ?
      sentryVitePlugin({
        org: "Hopp",              // Sentry organization slug
        project: "tauri-app",       // Sentry project name
        authToken: process.env.SENTRY_AUTH_TOKEN, // Auth token with proper scopes
      })
      : undefined,
  ],
  // ... other config (e.g., resolve.alias, etc.)
  build: {
    sourcemap: true,  // crucial: generate source map files for production
  },
});
- A crucial step is to ignore the source-map files in the built app. In our case we utilized the
beforeBuildhook to exclude them from the final bundle. It looks like this:"beforeBuildCommand": "yarn build && rm -rf ./dist/assets/*.js.map"
With this setup, here’s what happens when we build our app:
- Vite generates the JavaScript bundles and the corresponding
.mapfiles (thanks tosourcemap: true). - The Sentry Vite plugin kicks in at the end of the build, uploading those
.mapfiles to Sentry. - We remove the source-map files from the build directory.
- We publish our app without including the
.mapfiles in the bundle (the end-user package stays~12 MB, no increase).
Verifying It Works (Readable Errors at Last!)#
With our code deployed using this new setup, we wanted to make sure everything was working correctly. To test it, we added a little snippet in our app that intentionally throws an error when a button is clicked:
<Button onClick={toggleSound}>
  {isPlaying ? "Stop call sound" : "Play call sound"}
</Button>

<Button onClick={() => { throw new Error("Oh no an error"); }}>
  Test Sentry Error
</Button>
When we run the app and click the Test Sentry Error button, it triggers an error ("Oh no an error"). This error is reported to Sentry by our configured Sentry React SDK. Now comes the moment of truth: checking Sentry’s dashboard for this error.
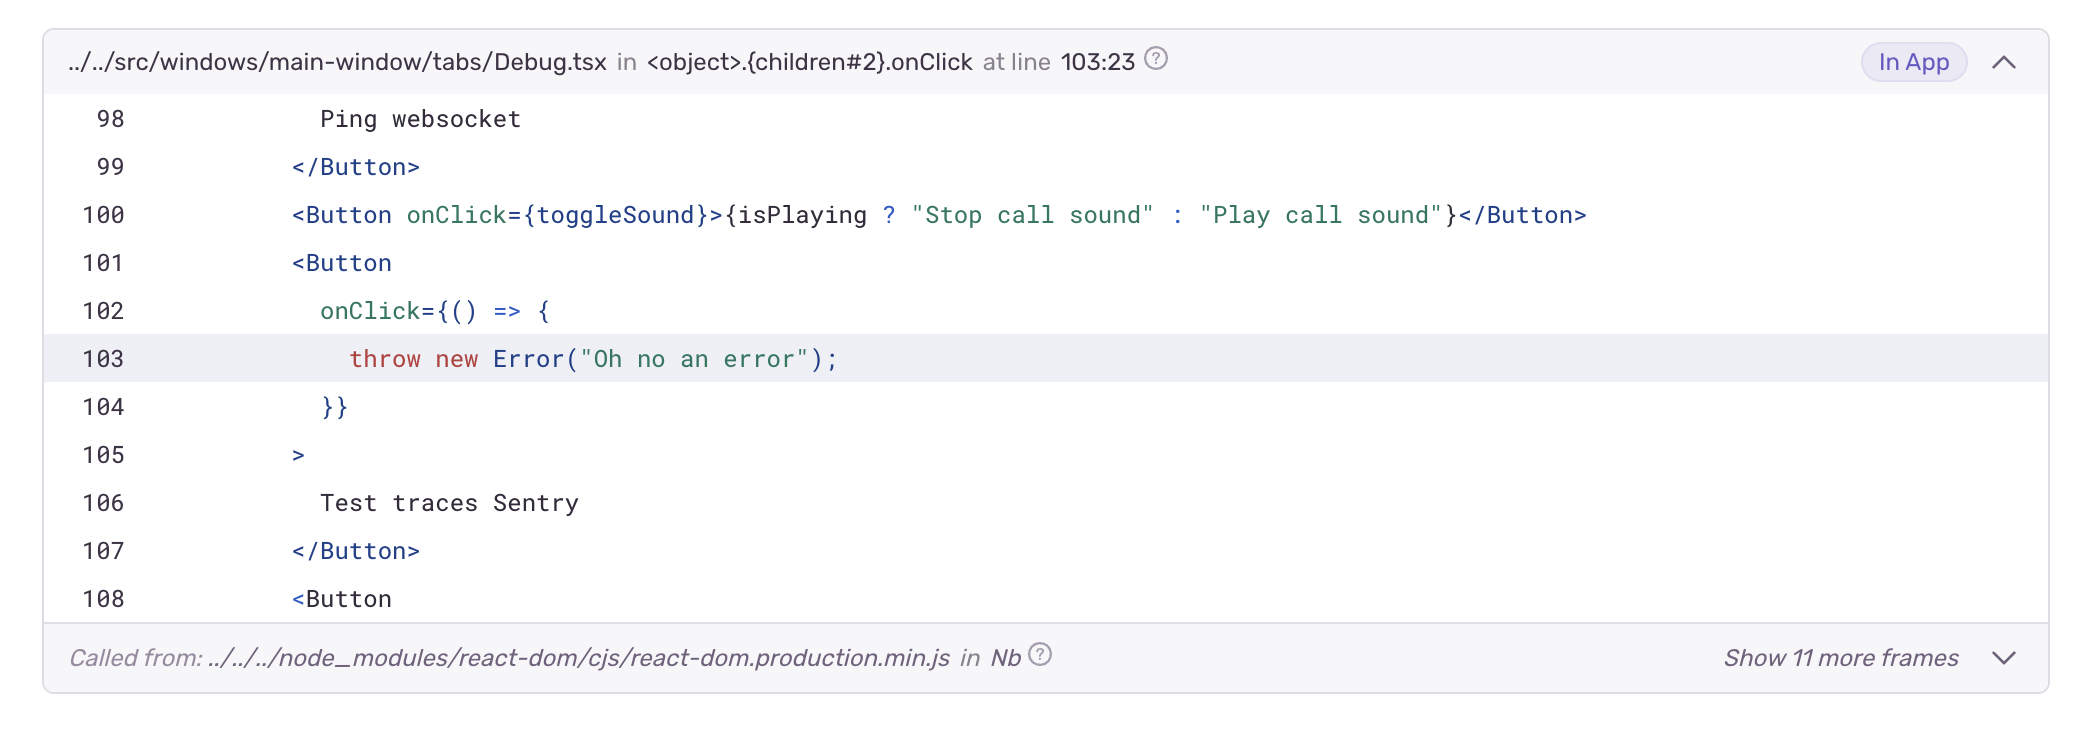
Notice in the screenshot how Sentry provides the function name and source code snippet where the error occurred. This is possible only because Sentry could map the minified code back to our original TypeScript/JSX, thanks to the uploaded source map. Without the source map, we would have just seen something like Error: Oh no an error at app.bundle.js:1:10567, which is not actionable.
Ditch the frustrating "Can you see my screen?" dance.
Code side-by-side, remotely.
Conclusion#
By integrating source maps with Sentry, we’ve drastically improved our debugging experience in production. Instead of cryptic stack traces, we get clear insights into errors as if we were running the app in development. The Sentry Vite plugin made this fairly straightforward to set up, handling the heavy lifting of uploading maps and associating them with releases.
In our case, this setup has already paid off. We can track down issues in Hopp’s app much faster now, because the errors tell us exactly where to look. If you’re using Sentry for a JavaScript app, take advantage of source maps and your future self debugging a production issue will thank you!
If you have questions or want to discuss source-maps and debugging further, feel free to reach out on X/Twitter or email me directly at costa@gethopp.app.